- The Numbers Game
The overseas factor in the IPL
One of the key aspects of the IPL is the concept of putting together top-class international players from different countries with domestic cricketers, some of whom have hardly played much first-class cricket. For the foreign players, the challenge is to live up to their top billing, and justify the amounts invested in them, as also to get used to conditions that some of them may not be familiar with. Players from some countries have been a bigger success than others, and have greatly impacted the fortunes of their sides. Here's a look at the country-wise batting and bowling numbers in the IPL, and the amount that each franchise has relied on its overseas stars.
It's obvious that overseas players are expected to contribute significantly, since many of them are among the best in the business. Not surprisingly, the overseas stars have put in plenty of game-changing performances: in ESPNcricinfo's analysis of best displays (updated till May 6), 31 of the top 50 batting performances, and 27 of the top 50 bowling ones, are by overseas players. The top run-getter is a foreign player (though there are plenty of Indian names among the top few as well), while the three best bowlers in the tournament are all overseas ones - Lasith Malinga, Morne Morkel and Sunil Narine.
Among the various foreign players, the Australians and the South Africans are the ones who've had the most impact on the IPL so far, with both bat and ball. Australia didn't have a full presence in the early part of the IPL since some of their players were away on tour to the West Indies, but despite that they've scored the highest number of runs among foreign players, and taken the second-highest number of wickets. Several of them have made strong cases to be included in the World Twenty20 in Sri Lanka later this year.
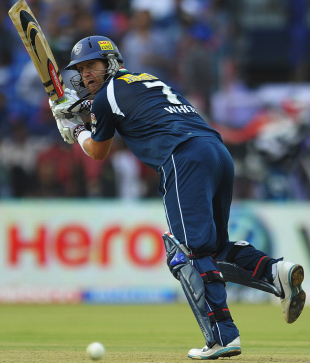
The most consistent from Australia in this IPL has been Cameron White. He hasn't always enjoyed the IPL, but this season he has been the one bright spot in a sea of misery for Deccan Chargers, with 410 runs - the sixth highest - at 45.55 and a strike rate of almost 152. Steven Smith, Shaun Marsh, David Hussey and Brad Hodge have done pretty well too, and with Shane Watson and David Warner showing terrific form, the Australian contribution could be even more in the last couple of weeks of the tournament.
The two other national sides that have contributed 1000-plus runs are South Africa and West Indies, thanks largely to the outstanding form of Faf du Plessis, AB de Villiers and Chris Gayle. New Zealand, on the other hand, have been largely disappointing, with both Ross Taylor and Brendon McCullum struggling for runs.
All stats updated till May 9
| Batsmen from | Batsmen* | Innings | Runs | Average | Strike rate | % of runs |
| India | 93 | 463 | 8033 | 22.50 | 119.81 | 53.95 |
| Australia | 23 | 96 | 2200 | 28.95 | 129.18 | 14.77 |
| South Africa | 15 | 82 | 1401 | 24.58 | 128.30 | 9.41 |
| West Indies | 7 | 44 | 1083 | 32.82 | 139.20 | 7.27 |
| New Zealand | 6 | 42 | 769 | 22.62 | 106.51 | 5.16 |
| Sri Lanka | 8 | 37 | 655 | 21.83 | 113.91 | 4.40 |
| England | 3 | 22 | 603 | 37.69 | 142.55 | 4.05 |
| Pakistan# | 1 | 6 | 101 | 20.20 | 144.28 | 0.68 |
| Bangladesh | 1 | 3 | 24 | 8.00 | 109.09 | 0.16 |
| Netherlands | 1 | 3 | 21 | 10.50 | 100.00 | 0.14 |
| Total | 158 | 798 | 14890 | 24.29 | 122.94 | 100.00 |
Among the bowlers, though, South Africa have been the biggest overseas contributor, with 71 wickets, of which 41 have been taken by Morne Morkel, Dale Steyn and Jacques Kallis. Sri Lanka's numbers are outstanding because of Lasith Malinga and Muttiah Muralitharan, while Sunil Narine's mystery spin has propped up the numbers for West Indies.
The Indians have contributed 52% of the total wickets taken by bowlers in the tournament, which is slightly lower than their percentage contribution of runs.
All stats updated till May 9
| Bowlers from | Bowlers* | Wickets | Average | Econ rate | % of wkts |
| India | 69 | 285 | 33.36 | 7.85 | 52.20 |
| South Africa | 13 | 71 | 24.76 | 7.40 | 13.00 |
| Australia | 18 | 62 | 22.26 | 7.49 | 11.36 |
| West Indies | 7 | 53 | 21.49 | 7.32 | 9.71 |
| Sri Lanka | 6 | 39 | 17.26 | 6.73 | 7.14 |
| New Zealand | 4 | 14 | 30.36 | 7.33 | 2.56 |
| Pakistan | 1 | 8 | 25.62 | 7.50 | 1.47 |
| England | 3 | 7 | 26.00 | 7.58 | 1.28 |
| Bangladesh | 1 | 6 | 10.67 | 5.81 | 1.10 |
| Netherlands | 1 | 1 | 24.00 | 8.00 | 0.18 |
| Total | 123 | 546 | 28.12 | 7.63 | 100.00 |
Gayle and de Villiers have been outstanding with the bat for Royal Challengers, while Tillakaratne Dilshan has played a fine supporting role, but the Indian batsmen have contributed little to the team, apart from Virat Kohli's innings against Mumbai Indians. That's clear from the table below too, which shows the runs scored by Indian and overseas players for each team. The Indian players have scored only 637 runs for Royal Challengers at an average of 16.76 and a striker rate of 111, while the foreign players have scored more than 1000 runs, averaging almost 41 at a strike rate of 145. In fact, they're the only team for which the overseas contribution has topped 1000 runs.
On the other hand, for Mumbai Indians and Kolkata Knight Riders, the home batsmen have scored more runs at a better rate than the overseas ones. Mumbai Indians haven't had one outstanding batsman, but most of their runs have come from Rohit Sharma, Ambati Rayudu and Sachin Tendulkar, while Gautam Gambhir has been by far the key man for Knight Riders.
| Team | Ind bat-runs | Average | Strike rate | Overseas-runs | Average | Strike rate |
| Royal Challengers Bangalore | 637 | 16.76 | 111.36 | 1062 | 40.85 | 145.08 |
| Deccan Chargers | 698 | 17.45 | 116.53 | 897 | 30.93 | 128.33 |
| Kings XI Punjab | 902 | 19.61 | 118.53 | 815 | 27.17 | 122.56 |
| Chennai Super Kings | 914 | 20.31 | 116.43 | 722 | 30.08 | 133.46 |
| Mumbai Indians | 1073 | 22.35 | 117.65 | 534 | 16.18 | 107.44 |
| Pune Warriors | 963 | 24.07 | 114.23 | 873 | 22.97 | 122.10 |
| Kolkata Knight Riders | 973 | 25.61 | 123.95 | 480 | 18.46 | 107.14 |
| Delhi Daredevils | 834 | 28.76 | 145.55 | 668 | 29.04 | 118.02 |
| Rajasthan Royals | 1140 | 30.00 | 120.63 | 705 | 32.04 | 149.05 |
The overall bowling averages are much better for the overseas bowlers - they average 22.41 per wicket, compared to 33.36 for the Indian bowlers - but in terms of wickets contribution, only for Super Kings have they taken more wickets than the Indian bowlers. However, the difference in averages is quite stark in some cases: in the case of Royal Challengers, their Indian bowlers have taken 37 wickets, but at a poor average of 41.30 and an economy rate of more than 8.50; the overseas bowlers concede less than half the number of runs per wicket, and have a much better economy rate too. Similarly, Malinga and Morne Morkel have significantly improved the averages for Mumbai Indians and Daredevils.
| Team | Ind bowl-wkts | Average | Econ rate | Overseas-wkts | Average | Econ rate |
| Chennai Super Kings | 22 | 34.59 | 7.44 | 31 | 27.00 | 8.05 |
| Delhi Daredevils | 33 | 32.76 | 7.35 | 26 | 17.35 | 7.16 |
| Kolkata Knight Riders | 34 | 24.50 | 6.65 | 27 | 22.92 | 7.20 |
| Deccan Chargers | 35 | 31.40 | 8.25 | 20 | 32.35 | 7.92 |
| Royal Challengers Bangalore | 37 | 41.30 | 8.54 | 15 | 20.13 | 7.36 |
| Pune Warriors | 38 | 33.29 | 7.86 | 21 | 30.14 | 7.11 |
| Rajasthan Royals | 44 | 27.93 | 8.11 | 25 | 22.92 | 6.90 |
| Kings XI Punjab | 47 | 30.91 | 7.71 | 19 | 18.84 | 7.73 |
| Mumbai Indians | 48 | 27.42 | 7.50 | 24 | 15.50 | 6.76 |
S Rajesh is stats editor of ESPNcricinfo. Follow him on Twitter
© ESPN Sports Media Ltd.
Live Sports
Communication error please reload the page.
-
Football
-
Cricket
-
Rugby
-
- Days
- Hrs
- Mins
- Secs
F1 - Abu Dhabi GP
Abu Dhabi Grand Prix December 11-13 1. Max Verstappen ()
2. Valtteri Bottas (Mercedes)
3. Lewis Hamilton (Mercedes)
4. Alexander Albon ()
5. Lando Norris ()
6. Carlos Sainz Jr ()
-
ESPNOtherLive >>
Snooker - China Open
Tennis - Miami Open
In-depth on 
- AB de Villiers
- Cameron White
- Chennai Super Kings
- Chris Gayle
- Deccan Chargers
- Delhi Daredevils
- Kings XI Punjab
- Kolkata Knight Riders
- Lasith Malinga
- Last week's column: The IPL's most and least productive overs
- Morne Morkel
- Mumbai Indians
- Pune Warriors
- Rajasthan Royals
- Royal Challengers Bangalore
- Sunil Narine