|
Super Rugby Statistics
Brumbies and Chiefs set for a thriller
Richard Kelly
July 17, 2014
Super Rugby: Qualifying Finals
And somehow, we're already at the business end of the season and knockout rugby beckons. Super Rugby's regular rounds have come and gone and only six teams are left standing. To set the tone we preview this week's play-offs for the semi-finals.
Brumbies v ChiefsIn a repeat of the 2013 Super Rugby final, we have a very intriguing contest in store first up on Saturday. The Chiefs appear to have recovered from a mid-season slump while the Brumbies have ironed out some weaknesses to finish the season strongly. This has been a closely fought match-up since the inception of Super 14 in 2006, with seven of the nine fixtures having been settled by a points difference of single figures despite 442 points being scored in total. The Brumbies did gain some revenge for their 2013 grand final defeat with a 41-23 win earlier this season, an unprecedented margin of victory in the past nine years. Perhaps crucially, the past six games between the sides have been won by the hosts. 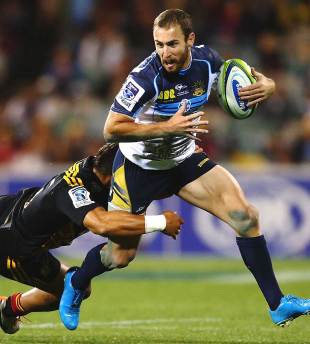
Nic White's influence could prove pivotal against the Chiefs
© Getty Images
Enlarge
2014 trends The Brumbies' goal-kicking success rate has been the poorest in the competition this season, landing just 63% of their shots at the sticks. Nic White has done OK, slotting 39 of 53 attempts (74%) , but the principal kicker, Christian Leali'ifano, has been successful with fewer than half his attempts (21/43). An equally worrying stat for the Brumbies outfit is their ability to retain possession at the scrum, as their success rate of 76% is the lowest in the competition and way below the competition average of 86%. The story doesn't end there, though, as the defensive success rate of their opponents is a competition-high 88%, while their average of 5.8 turnovers won is the lowest across all three conferences. But it's not all bad for the Brumbies, as they know their way over the try line despite ranking low in numerous areas. Their ball retention rate at the breakdown is the best in the competition so they allow fewer turnovers won from their opponents than any other side. While the Brumbies do little to worry opposition defences in terms of missed tackles, the Chiefs are the best tacklers in the competition. They have missed fewer tackles than any other side and have the best success rate in the competition. However, they have conceded the most penalties in the competition, while being the beneficiaries of fewer penalties and free kicks than anyone else. The Brumbies have their own troubles at scrum time, but the Chiefs have caused the most minimal impact at opposition scrums this season - with their opponents winning 92% of their own feeds. The Chiefs' opponents spend the least time in occupancy of the ball per game. One quirk thrown up by this fixture is that both these sides have leaked exactly 378 points this season.
The key men The home side will hope to keep Nic White on the paddock for as long as possible in this game, and not only for his kicking form. The Wallabies scrum-half has registered at least four more try assists than any other player this season, and his creative spark will be key. If the Brumbies can release the likes of Jesse Mogg, they might have too much firepower for the Chiefs at home. Up front, the lineout form of Ben Mowen and the destructive nature of Scott Fardy in the loose are important. The Chiefs are likely to be adventurous in a bid for victory, and Tawera Kerr-Barlow and Tim Nanai-Williams are among the top five offloaders in the competition this season. Tom Marshall has perhaps been their most elusive runner, amassing 33 defenders beaten. 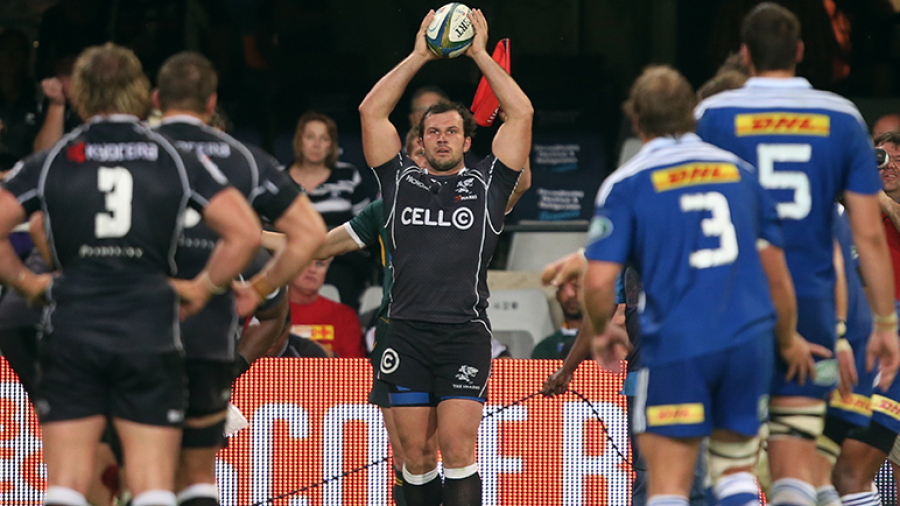
The Sharks boast a tremendous lineout © Getty Images
Enlarge
Sharks v HighlandersThe Sharks Despite dominated this fixture for many seasons, but they are without a win against the Highlanders since 2012. Three of the past four games between these sides have been won by a margin of 12-plus points, and there has been a full-time points difference of fewer than seven points only twice in eight meetings since 2006. 2014 trends The Sharks have struggled to get over the line this year, and only the Bulls (28) have scored fewer tries than them (29). But they have kicked the most penalties in the competition to get their average points haul over 25 per game, while they also produce the most kicks from hand per game (31.1). Their games can become a game of kick tennis ("Jakeball"), as they are also the recipients of more kicks from hand than any other side. The Sharks have produced the most turnovers conceded in the competition, but this has done little for the opposition; only the New South Wales Waratahs have shipped fewer points than the South African side. The Sharks have attempted fewer tackles per game than any other side this season, while the Highlanders have attempted the most. The New Zealanders spend the least time in possession per game, and their opponents spend the most. While the Highlanders do not make many carries, they are efficient when it comes to breaking tackles and they have caused the lowest opposition tackling success rate in the competition in 2014. This clash of styles could mean we are in for an interesting match in the second game this weekend. The key men Stephan Lewies is the top player in the competition when it comes to lineouts on both home and opposition throws: he has taken more catches (77) and steals (10) than anybody else, and the Highlanders need to be watchful of him at the throw. The kicking of Francois Steyn will also be key, and the Springboks sharp-shooter will surely make the Highlanders if the visitors give away penalties - even in the opposition half; Steyn has landed 78% of his shots at goal this year, including one attempt 61 metres from the sticks. Malakai Fekitoa is perhaps the season's breakout star, and his haul of 61 defenders beaten is at least 10 more than anybody else could manage. Full-back Ben Smith has also been in imperious form, finishing the season as the competition's top metre-maker (1182), while Richard Buckman ranked fifth for turnovers won (17).
Follow @OptaJonny, the official Twitter page for Opta's coverage of rugby union and rugby league, and @OptaJason, the official Twitter page for Opta Sports' coverage of sport in Australia and New Zealand. © ESPN Sports Media Ltd
|
Live Sports
Communication error please reload the page.
-
Football
-
Cricket
-
Rugby
-
- Days
- Hrs
- Mins
- Secs
F1 - Abu Dhabi GP
Abu Dhabi Grand Prix December 11-13 1. Max Verstappen ()
2. Valtteri Bottas (Mercedes)
3. Lewis Hamilton (Mercedes)
4. Alexander Albon ()
5. Lando Norris ()
6. Carlos Sainz Jr ()
-
ESPNOtherLive >>
Golf - Houston Open
Snooker - China Open
Tennis - Miami Open