|
Super Rugby
Crusaders and Waratahs just favoured by numbers
Richard Kelly
July 24, 2014
Greg Growden and Russell Barwick preview the Super Rugby semi-finals
We're two thrilling qualifying matches down and, with hardly a moment for us all to draw breath, two mouth-watering semi-finals await this weekend. We preview the New South Wales Waratahs- Brumbies and Crusaders-Sharks fixtures. Strap yourself in; this will be an exciting ride.
Crusaders v SharksRecent history Dan Carter rejuvenated, ready to fire
%]The Sharks have won the past two meetings between the sides, including a confidence-boosting 30-25 success in New Zealand earlier this season. But the Crusaders had won the previous five matches between the sides. 2014 trends The Crusaders conceded fewer penalties per game than any other side this season, and their discipline at the breakdown was just as impressive. They also ranked high with their lineout (89%) and scrum (88%) success rates. The Sharks' try-scoring was among the most modest this season, their average of 1.9 per game the third worst in Super Rugby. They produced the most kicks from hand, while their average of 97 attempted tackles per game is the lowest in the competition - also indicating that teams kick more often against them. Despite this, their turnover rate is the highest in the competition. 2014 opposition averages The Crusaders allowed their opponents to produce fewer offloads than any other side, and they were particularly strong in influencing lineouts not on their own throw. Their opponents won just 78% of their lineouts, a lower success rate than against any other side. While the Sharks produced the most kicks from hand, they were also the recipients of the most on average. The Crusaders excelled at opposition lineouts, but the South African outfit forced the worst success rate at opposition scrums and rucks / mauls. 2014 h2h stats (one match) Sharks 31-27 Highlanders (Australia only)
%]The Sharks produced a brilliant backs-against-the-wall display in their meeting in New Zealand earlier this season, when they scored three tries to one despite making 41 fewer carries. One would think they'll look to churn out a similar display this time around, though their scrum must hold up better than it did before (likely, given their demolition of the Highlanders last week) and the Crusaders are unlikely to be drawn into another duel of kicking from hand.
Last week (Sharks) The Sharks showed they can go toe to toe with anyone with ball in hand, dictating possession and coming up with three tries and a host of defenders beaten. Their defence was unusually loose, however, and a similar display will suit the Crusaders at home. 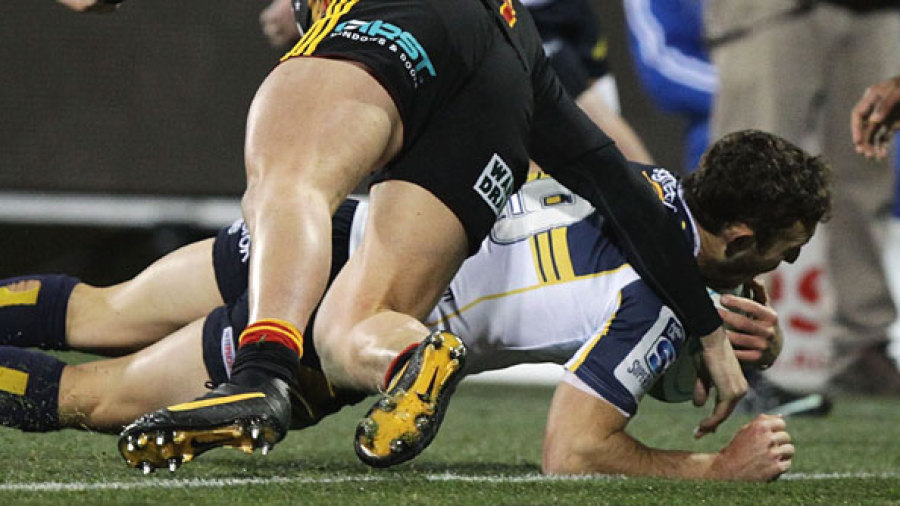
Nic White and the Brumbies were quick out of the blocks against the Chiefs © Getty Images
Enlarge
Waratahs v BrumbiesRecent history The most recent clash between the sides saw the Waratahs swarm over their Canberra rivals on home soil, but the Brumbies were undermanned on that occasion having won the first game this season and had the better of this fixture in recent seasons. The Brumbies have won four of the six meetings between these Australia rivals since the start of 2012. 2014 trends The Waratahs have scored more and conceded fewer points per game than any other team this season. They also topped the charts for average carries, metres, clean breaks, offloads and passes, opting to kick the ball out of hand less often than any other side. The Brumbies, meanwhile, struggled in some key areas but still managed to get over the try line often enough to carry them this far. Their goal-kicking and scrum success rates were the worst in the division, though they were the most stringent team at the breakdown. 2014 opposition averages One slip-up will cost Tahs: Cheika
%]Opponents of the Waratahs struggled to gain ground having made fewer carries than against anyone else. The Brumbies were on the end of an average of 6.2 opposition turnovers won per game, fewer than any other side. 2014 h2h stats (averages from two matches) The Waratahs dominated possession across the two matches, as they have so often throughout this season, and they will be very difficult to beat in the semi-final if they can match their low rate of penalties and turnovers. The Brumbies need to improve their discipline and respect for the ball, as their regular game involves getting a strong hand with regards to control of the ball.
Last week (Brumbies) Brumbies 32-30 Chiefs (Australia only)
%]The Brumbies produced a whirlwind display and managed an incredible 35 defenders beaten against the Chiefs, a remarkable statistic given the defensive success rate of all opponents against them was a competition-high 88%, while the Chiefs had missed fewer tackles than any other side to boast the best success rate in the competition. In a timely boost, their lineout was faultless (which could be important given the Tahs' well-documented failings in their latest game, against Queensland Reds) and they maintained their strong ball retention rate at the breakdownagainst very physical opponents. Their continued poor goal kicking very nearly cost them a passage to the semi-finals, however, and that is something they can ill-afford in Sydney.
Follow @OptaJonny, the official Twitter page for Opta's coverage of rugby union and rugby league, and @OptaJason, the official Twitter page for Opta Sports' coverage of sport in Australia and New Zealand. © ESPN Sports Media Ltd with Opta Sports
| ||||||||||||||||||||||||||||||||||||||||||||||||||||||||||||||||||||||||||||||||||||||||||||||||||||||||||||||||||||||||||||||||||||||||||||||||||||||||||||||||||||||||||||||||||||||||||||||||||||||||||||||||||||||||||||||||||||||||||||||||||||||||||||||||||||||||||||||||||||||||||||||||||||||||||||||||||||||||||||||||||||||||||||||||||||||||||||||||||||||||||||||||
Live Sports
Communication error please reload the page.
-
Football
-
Cricket
-
Rugby
-
- Days
- Hrs
- Mins
- Secs
F1 - Abu Dhabi GP
Abu Dhabi Grand Prix December 11-13 1. Max Verstappen ()
2. Valtteri Bottas (Mercedes)
3. Lewis Hamilton (Mercedes)
4. Alexander Albon ()
5. Lando Norris ()
6. Carlos Sainz Jr ()
-
ESPNOtherLive >>
Golf - Houston Open
Snooker - China Open
Tennis - Miami Open