Super Rugby
Izzy firing in attack, Whiteley a wall in defence
Richard Kelly
March 26, 2015
Greg Growden casts an eye over Super Rugby Round 7

We're just about through the first third of the Super Rugby season and the unbeaten Hurricanes are clear at the top of the standings. The competition leaders have played five games after having the bye last week, with the Brumbies, Force, Chiefs, Sharks and Lions the only teams to have featured in each of the six rounds. At this juncture, we've decided to use the Opta Index to take a look at some of Super Rugby's top early performers for season 2015.

Going by Opta's points-scoring system, which is explained at the foot of this article, we take the top scoring forwards and backs of the season and examine why our number crunching has them as the top dogs.

Backs

Handre Pollard (Bulls): 449

  • The tournament's top points-scorer (92) has maintained the best goal-kicking success rate (85%) of any player to successfully land at least 15 shots at goal.
  • No fly-half has scored more tries than Pollard.
  • Just two other No.10s have managed more defenders beaten than the South African.
  • He landed a goal kick from more than 59 metres this season.

Springboks tyro Handre Pollard continues to impress in Super Rugby © Getty Images
Enlarge

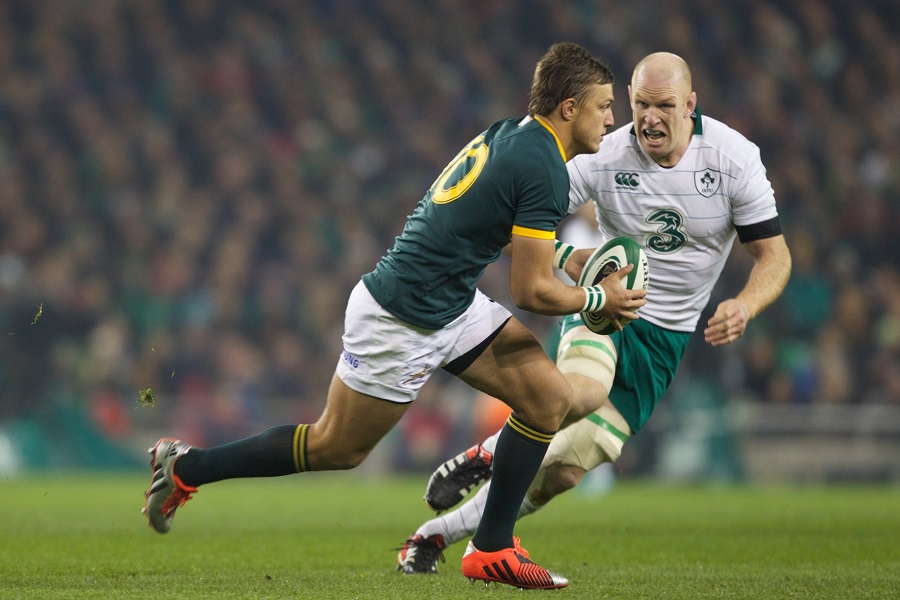
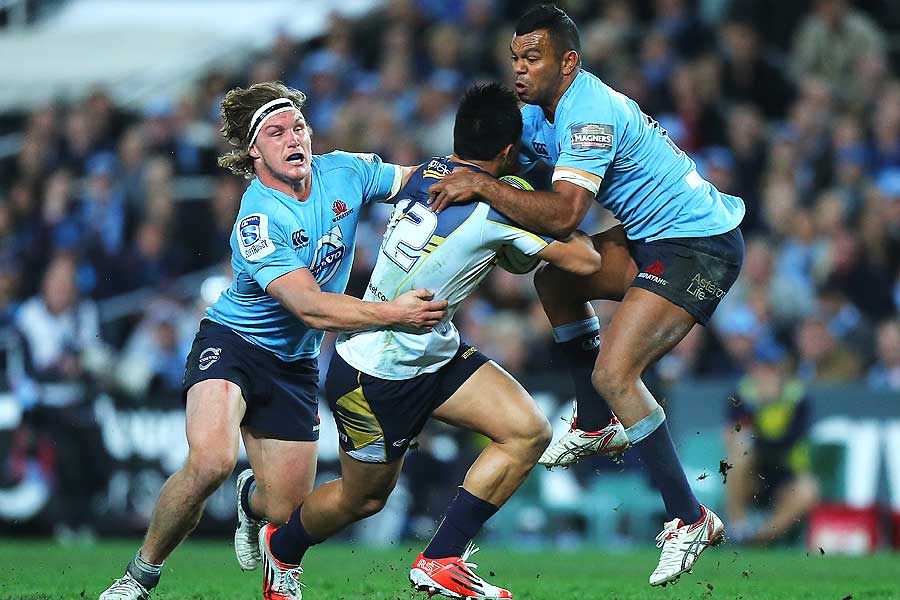
Israel Folau (Waratahs): 388

  • The tournament's top metre-maker.
  • He has made the most offloads and beaten the most defenders.
  • Ranks third for try assists this season.
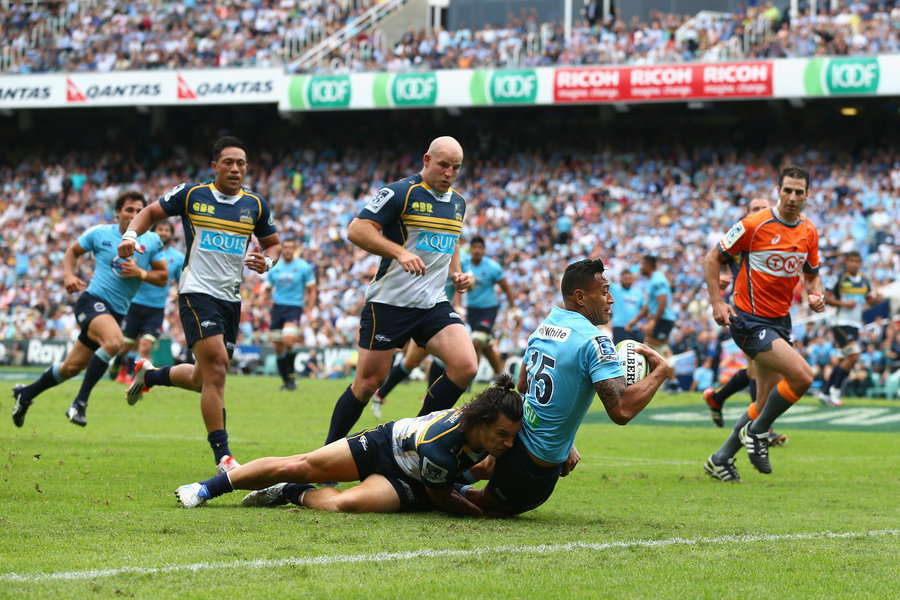
Israel Folau enjoyed his best performance in 2015 against the Brumbies last weekend © Getty Images
Enlarge

Patrick Lambie (Sharks): 369

  • Ranks equal first among fly-halves for tries scored.
  • One of two players to score 90+ points, at least 30 more than anybody else.
  • Has gained more metres than any other fly-half.
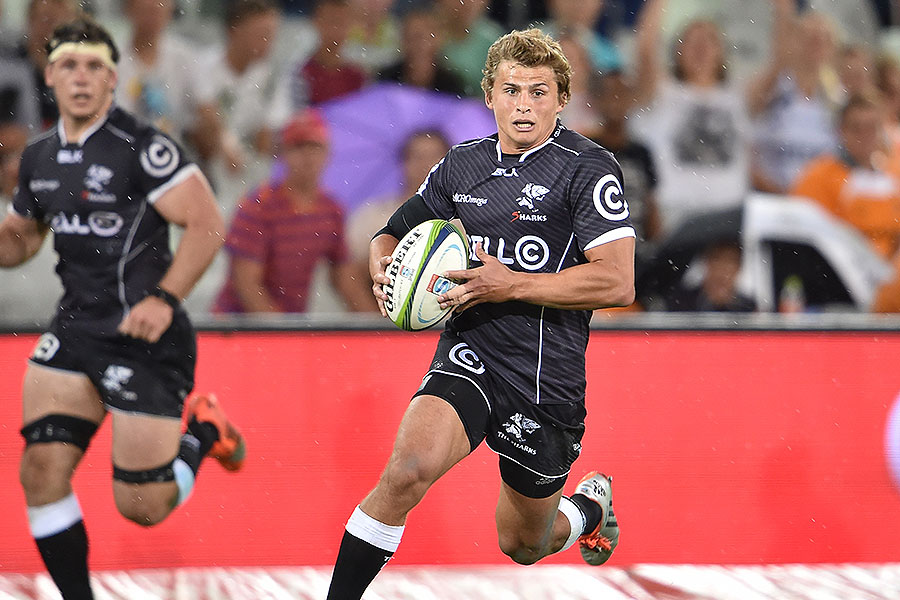
Patrick Lambie continues to lead the way for the Sharks © Getty Images
Enlarge

Ben Smith (Highlanders): 337

  • Among the tournament's top five offloaders and top five ball carriers.
  • Among the top 10 players for defenders beaten, clean breaks and metres gained.
  • No other full-back has won more turnovers than Smith.

Waisake Naholo (Highlanders): 335

  • Has won the joint-most turnovers in the competition.
  • One of four men to beat more than 20 defenders and also ranks equal fourth for clean breaks.
  • Seventh in the competition for total metres.

NameHandre PollardPatrick LambieBen SmithIsrael FolauWaisake Naholo
TeamBullsSharksHighlandersWaratahsHighlanders
Appearances56555
Minutes Played389478400400400
Points92905510
Tries22112
Goal Kicking85%78%   
Carries3652596850
Metres162313331609361
Average Gain4.56.05.69.07.2
Clean Breaks16779
Defenders Beaten1411162321
Offloads1311147
Try Assists11040
Passes5953465424
Kicks in Play53542262
Tackles404614626
Missed Tackles810425
Tackle %83%82%78%75%84%
Turnovers Won33319
Turnovers Conceded693117
Penalties Conceded  2 4

Forwards

Warren Whiteley (Lions): 367

  • The top tackler in the tournament, Whitely has made at least 18 more than other player.
  • His 99% tackling success rate is the best of any player to make 30+ tackles.
  • He is one of two forwards to manage more than one try assist so far.
  • He ranks equal seventh among all players for turnovers won.
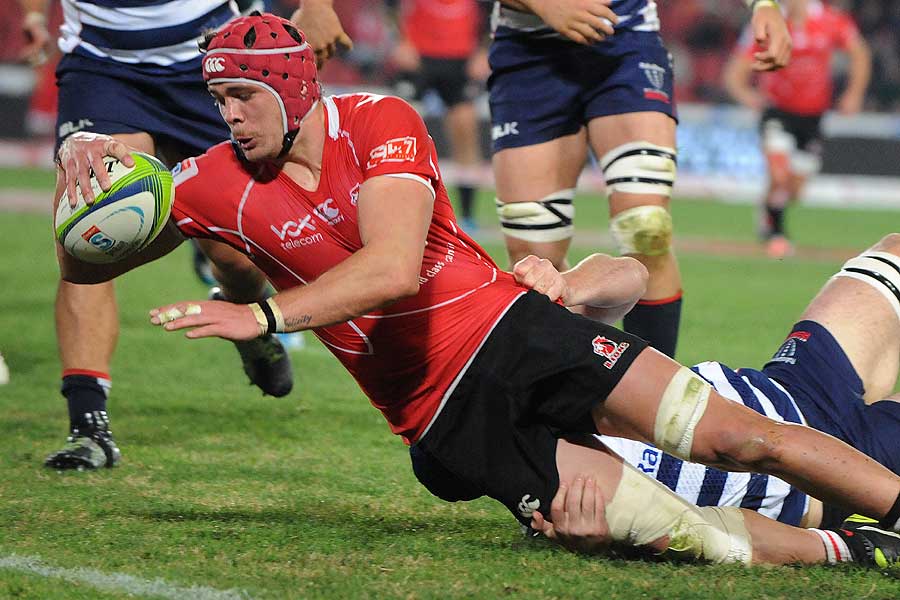
Warren Whiteley is easily the hardest working defensive player in Super Rugby © Getty Images
Enlarge

Sam Cane (Chiefs): 337

  • One of 10 forwards to score two or more tries.
  • He is the top offloading forward in the competition, and fourth overall.
  • Just four others have won more turnovers than Cane.
  • Ranks equal fifth among forwards for defenders beaten.
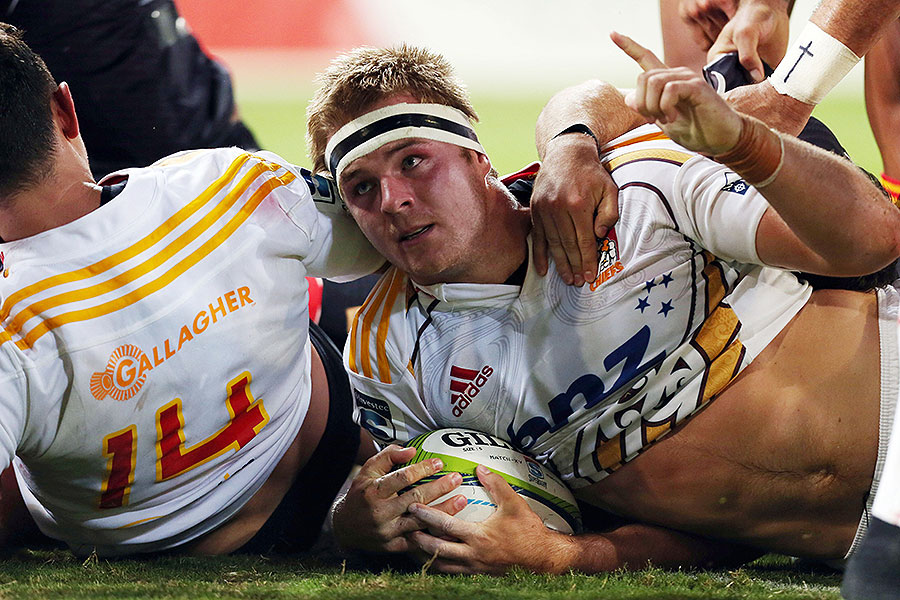
Chiefs flanker Sam Cane is proving a handful at the breakdown © Getty Images
Enlarge

Sean McMahon (Rebels): 320

  • He s the third-ranked forward for defenders beaten.
  • Ranked fifth for average tackles per game.
  • Has made the sixth most metres and ranks third for defenders beaten from the forwards.

Michael Hooper (Waratahs): 316

  • Has made more metres than any other forward.
  • Sits in top spot for clean breaks of any player wearing 1-8.
  • Is ranked equal first for defenders beaten among the forwards.
Michael Hooper was in fine form against the Brumbies © Getty Images
Enlarge

Luke Braid (Blues): 288

  • Ranks equal first among all players for turnovers won.
  • Of players to make over 30 tackles, he ranks sixth for success rate.
  • One of six forwards to reach double figures for defenders beaten this year.

NameLuke BraidMichael HooperSam CaneSean McMahonWarren Whiteley
TeamBluesWaratahsChiefsRebelsLions
Appearances55556
Minutes Played279400400390480
Points501000
Tries1 2  
Goal Kicking     
Carries4448504244
Metres147207106144141
Average Gain3.34.32.13.43.2
Clean Breaks36112
Defenders Beaten101510146
Offloads641115
Try Assists11002
Passes2816341440
Kicks in Play 1   
Tackles3368596694
Missed Tackles18271
Tackle %97%89%97%90%99%
Turnovers Won93867
Turnovers Conceded58665
Penalties Conceded 5542
Yellow Cards   11
Red Cards     
Lineouts Won1211016
Lineout Steals   14

How the Opta Index works

The Opta Index allows genuine opportunities to compare and contrast both player and team strengths and weaknesses across top flight rugby, providing real insights as follows:

After every match Opta completes a video analysis of every touch of the ball in rugby matches. Each action in the match is awarded a points value depending on the relative importance of the action.

For example, a try scores more points than a tackle but a player loses points for a missed tackle. The points are then weighted against the score at the time when the action took place (higher points if the score is closer), the time in the match (higher points at the start of the match) and the position on the pitch where it took place (higher points for actions closer to the goal line).

The player is then given a score for the match by adding up all his actions while he was on the field.

© Opta Stats for ESPN Sports Media Ltd.

Live Sports

Communication error please reload the page.