|
Super Rugby Statistics
Brumbies set to launch early onslaught against Force
Richard Kelly
July 10, 2014
Super Rugby Preview: Round 19
%]Super Rugby heads into the final round of the home-and-away season with much still to play for: New South Wales Waratahs, the Crusaders and the Sharks are assured of finals football, and the Highlanders can miss out only if they lose, the Chiefs win, and the Brumbies and Western Force draw or the match in Canberra sees the Brumbies scoring four tries in going down by fewer than seven points or if the Force ... The Highlanders are highly likely to know their fate before kick-off in Christchurch on Saturday so we're focusing on the Blues-Chiefs and Brumbies-Force matches on Friday. The winner of the Australian derby will make the finals, joined by the Chiefs if the back-to-back champions defeat the Blues; it's more complicated for the Blues, however, as they must defeat the Chiefs by 38 points while denying them a bonus point to stand even a mathematical chance of making the top six. 
Aaron Cruden is increasingly influential after returning from his broken thumb © Getty Images
Enlarge
Blues v ChiefsThese teams each have a reputation for razzle-dazzle and attacking rugby yet this season, going by tackling success rates, they are the top two defensive sides in the competition having completed 88% of their attempted hits. Indeed, the Chiefs' average of 13.9 misses per game is the lowest in Super Rugby this year. But the Blues' and Chiefs' respective average of 25.6 and 24.7 points shipped per game is above the competition average. The Blues have notched more points per game (27.4) than their opponents (24.9), thanks in part to their goal-kicking success rate (82%, third highest in Super Rugby). The Blues have averaged a 451-metre gain from 115 carries per game this season, similar to the Chiefs' 467 metres from 121 carries per game. They each spend similar amounts of time in possession, and are well matched when it comes to breaks, defenders beaten, passes and set-piece success rates. These are not numbers to excite Blues fans hoping for their final-round miracle The Chiefs are perhaps more of a mixed bag, though: they are the top offloaders in the competition with an average of 14.2 per game, but that comes with a high turnover rate. They have also conceded the most penalties in the competition, which will encourage the Blues given their success from the kicking tee. Also watch for the Blues to kick possession away more often than the Chiefs, who starve opponents of possession better than any other side. At the set-piece, the Chiefs have struggled to have any impact on opposition scrum feeds or lineout throws. 
The Blues and Keven Mealamu need a couple of miracles to make the finals
© Getty Images
Enlarge
The Chiefs have scored two fewer tries (43) than the Blues this season, but they have also conceded eight fewer (34). The two sides are well matched when it comes to tries scored from the position where their possession originated, though the Chiefs have conceded half the amount of tries (6) when it comes to tries scored from possessions that originated in the opposition half. Such a stat may encourage the Hamilton side to attack from deep. With regards to the breakdown of tries, the team's first-half attacking output is similar, though the Blues have conceded four more tries (11) than the Chiefs (7) in the opening 20. The second period promises to be extremely interesting, though. The Blues have scored more third-quarter tries (15) than any other side this season, and six more than the Chiefs, but the Chiefs have touched down on 18 occasions in the final quarter - second only to the Waratahs (20) and seven more than the Blues. Hence the Chiefs will definitely fancy their chances if they are within touching distance come the 60-minute mark.
Brumbies v ForceThe Brumbies have averaged more points per game this season (24.3) than the Force (21.2) despite their goal-kicking success rate sitting at just 64%, the lowest ratio in the competition. Christian Leali'ifano is kicking at just 47% this season (16/34) though Nic White has converted three of every four goal-kicks (39/52). Worryingly for the Brumbies, they also possess the lowest tackling (85%) and scrum (76%) success rates; given the Force have a decent set-piece and look to play multiple phases, these are aspects the Brumbies must address this week and again if they squeeze past their conference rivals if they are to harbour genuine ambitions of reaching the latter stages. Conversely, the Brumbies cause the highest tackling success rate from their opponents, meaning they evade a lower percentage of tackles than any other side. The Force have shipped marginally fewer points than the Brumbies this season despite seeing their opponents land 85% of their goals; no other side has been on the end of a higher success rate. The Force have conceded the fewest number of turnovers this season (197, an average of 13.1) but the Brumbies have the best ruck success rate (96%) in the competition. Both sides are respectful in possession, and they are well matched when it comes to number of carries and metres - making for a likely tight encounter in Canberra. 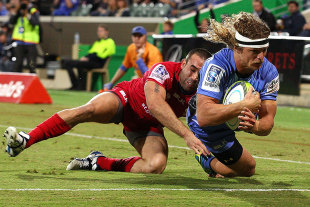
Nick Cummins is key for Western Force
© Getty Images
Enlarge
The Brumbies should look to expose their rivals in the opening half of each half, as they have scored 22 tries in the first and third quarter of games combined - double the Force's tally in the same 20-minute periods. Meanwhile, the Force have scored more tries (23) than the Brumbies (20) in the 20-minute period before half-time combined with the last segment after the hour-mark. The first quarter of the game might be especially key as the Brumbies have conceded just four tries in that time frame all season, half as many as the Force. The Brumbies may be in for a long night if the Force can survive any early onslaught. As for tactics, watch for the Brumbies to rely on their set-piece to get them into positions to score tries. Despite their low scrum success rate, they have scored more tries (12) than any other side from possessions that originated with scrums; they have also scored the second-most tries from lineouts (19; the Reds have notched 20). The Force have managed 18 tries from both set-pieces combined. 
The Brumbies need more involvement from Jesse Mogg © Getty Images
Enlarge
Follow @OptaJonny, the official Twitter page for Opta's coverage of rugby union and rugby league, and @OptaJason, the official Twitter page for Opta Sports' coverage of sport in Australia and New Zealand. © ESPN Sports Media Ltd with Opta Sports
|
Live Sports
Communication error please reload the page.
-
Football
-
Cricket
-
Rugby
-
- Days
- Hrs
- Mins
- Secs
F1 - Abu Dhabi GP
Abu Dhabi Grand Prix December 11-13 1. Max Verstappen ()
2. Valtteri Bottas (Mercedes)
3. Lewis Hamilton (Mercedes)
4. Alexander Albon ()
5. Lando Norris ()
6. Carlos Sainz Jr ()
-
ESPNOtherLive >>
Snooker - China Open
Tennis - Miami Open